Hitter research framework · 2026
Hitter Evaluation Research: Chase Rate × Whiff Rate
A two-axis framework separating swing-decision risk from contact risk, with hitter archetypes, scouting follow-up questions and a proposed quantitative validation design.
Conceptual · not statistically validated
Explores why strikeout rate alone does not describe every hitter’s offensive risk. The framework has no fitted model, validated thresholds or measured predictive accuracy. Proposed historical holdout testing is future work, not a reported result.
The original PDF and the pages below are hosted directly on this website. If your browser does not display the embedded document, open the original PDF or use the page-by-page reader.
Read document text (accessible alternative)
Text extracted from the original PDF. Tables may lose alignment; consult the original for layout.
Page 1
NOAH HEMPEL   /   INDEPENDENT BASEBALL RESEARCH
Hitter Risk Framework | Chase x Whiff
BASEBALL OPERATIONS RESEARCH PORTFOLIO   |   OCTOBER 2026
RESEARCH FRAMEWORK / 04
Hitter Risk Assessment
Chase Rate × Whiff Rate
Interpretable evaluation framework | Conceptual work, not a trained model | October 2026
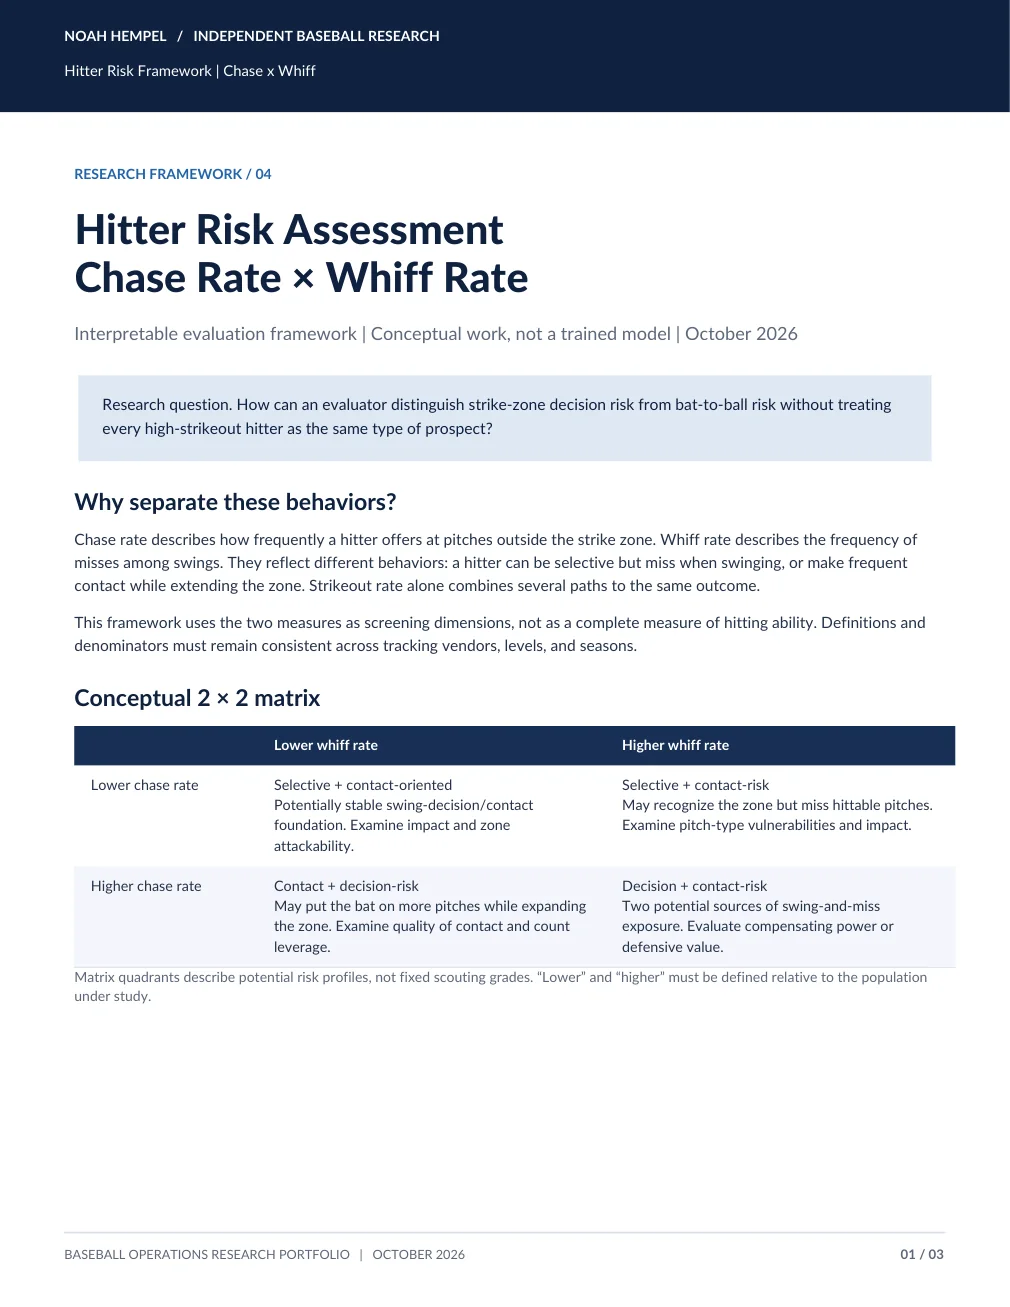
Research question. How can an evaluator distinguish strike-zone decision risk from bat-to-ball risk without treating
every high-strikeout hitter as the same type of prospect?
Why separate these behaviors?
Chase rate describes how frequently a hitter offers at pitches outside the strike zone. Whiff rate describes the frequency of
misses among swings. They reflect different behaviors: a hitter can be selective but miss when swinging, or make frequent
contact while extending the zone. Strikeout rate alone combines several paths to the same outcome.
This framework uses the two measures as screening dimensions, not as a complete measure of hitting ability. Definitions and
denominators must remain consistent across tracking vendors, levels, and seasons.
Conceptual 2 × 2 matrix
Lower whiff rate
Higher whiff rate
Lower chase rate
Selective + contact-oriented
Potentially stable swing-decision/contact
foundation. Examine impact and zone
attackability.
Selective + contact-risk
May recognize the zone but miss hittable pitches.
Examine pitch-type vulnerabilities and impact.
Higher chase rate
Contact + decision-risk
May put the bat on more pitches while expanding
the zone. Examine quality of contact and count
leverage.
Decision + contact-risk
Two potential sources of swing-and-miss
exposure. Evaluate compensating power or
defensive value.
Matrix quadrants describe potential risk profiles, not fixed scouting grades. “Lower” and “higher” must be defined relative to the population
under study.
01 / 03
Page 2
NOAH HEMPEL   /   INDEPENDENT BASEBALL RESEARCH
Hitter Risk Framework | Chase x Whiff
BASEBALL OPERATIONS RESEARCH PORTFOLIO   |   OCTOBER 2026
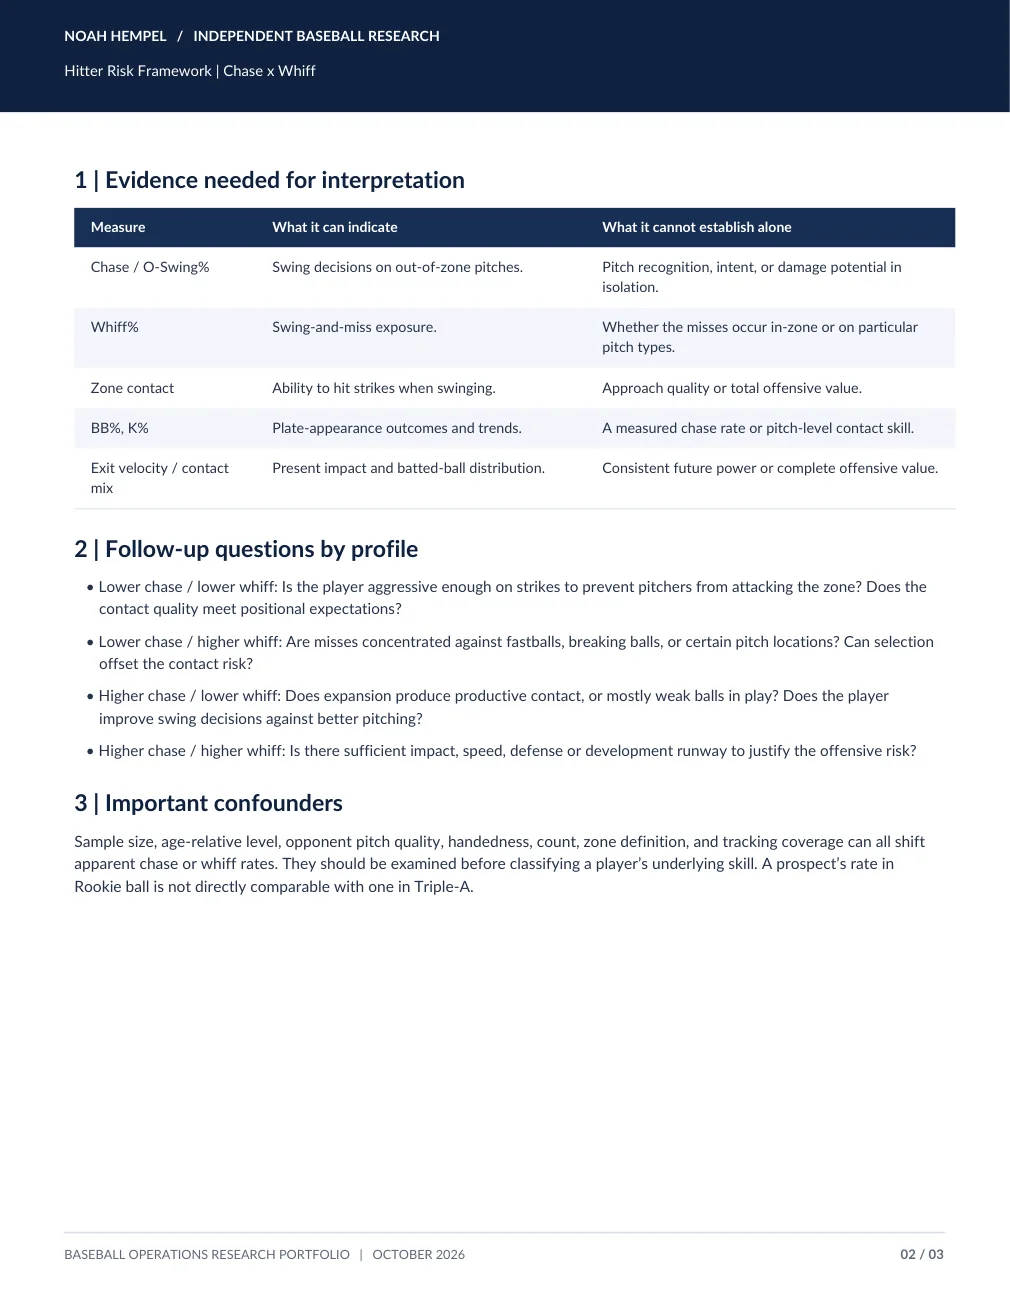
1 | Evidence needed for interpretation
Measure
What it can indicate
What it cannot establish alone
Chase / O-Swing%
Swing decisions on out-of-zone pitches.
Pitch recognition, intent, or damage potential in
isolation.
Whiff%
Swing-and-miss exposure.
Whether the misses occur in-zone or on particular
pitch types.
Zone contact
Ability to hit strikes when swinging.
Approach quality or total offensive value.
BB%, K%
Plate-appearance outcomes and trends.
A measured chase rate or pitch-level contact skill.
Exit velocity / contact
mix
Present impact and batted-ball distribution.
Consistent future power or complete offensive value.
2 | Follow-up questions by profile
• Lower chase / lower whiff: Is the player aggressive enough on strikes to prevent pitchers from attacking the zone? Does the
contact quality meet positional expectations?
• Lower chase / higher whiff: Are misses concentrated against fastballs, breaking balls, or certain pitch locations? Can selection
offset the contact risk?
• Higher chase / lower whiff: Does expansion produce productive contact, or mostly weak balls in play? Does the player
improve swing decisions against better pitching?
• Higher chase / higher whiff: Is there sufficient impact, speed, defense or development runway to justify the offensive risk?
3 | Important confounders
Sample size, age-relative level, opponent pitch quality, handedness, count, zone definition, and tracking coverage can all shift
apparent chase or whiff rates. They should be examined before classifying a player’s underlying skill. A prospect’s rate in
Rookie ball is not directly comparable with one in Triple-A.
02 / 03
Page 3
NOAH HEMPEL   /   INDEPENDENT BASEBALL RESEARCH
Hitter Risk Framework | Chase x Whiff
BASEBALL OPERATIONS RESEARCH PORTFOLIO   |   OCTOBER 2026
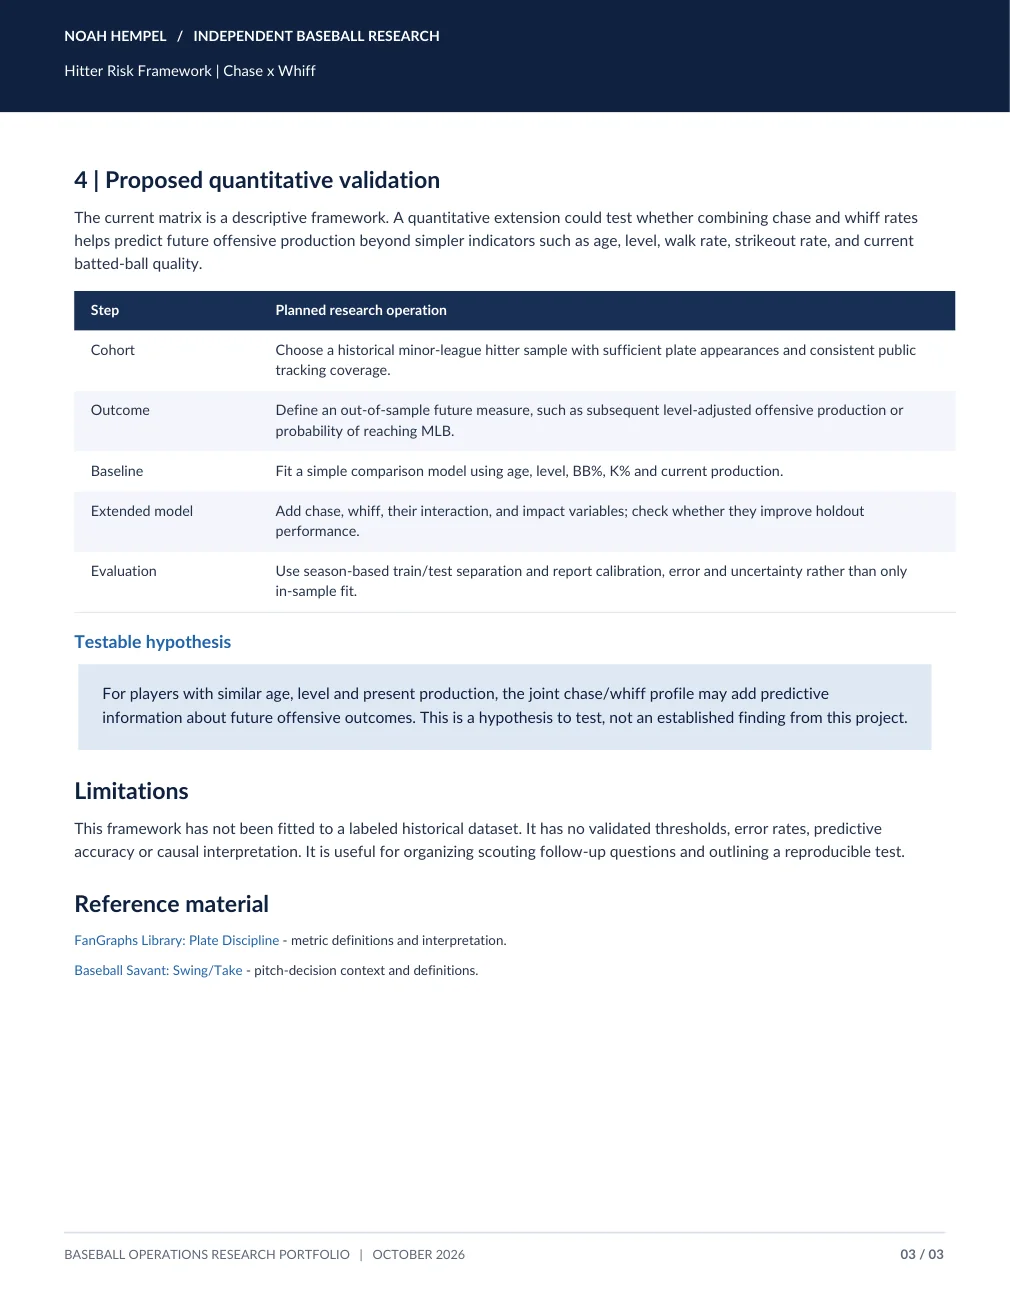
4 | Proposed quantitative validation
The current matrix is a descriptive framework. A quantitative extension could test whether combining chase and whiff rates
helps predict future offensive production beyond simpler indicators such as age, level, walk rate, strikeout rate, and current
batted-ball quality.
Step
Planned research operation
Cohort
Choose a historical minor-league hitter sample with sufficient plate appearances and consistent public
tracking coverage.
Outcome
Define an out-of-sample future measure, such as subsequent level-adjusted offensive production or
probability of reaching MLB.
Baseline
Fit a simple comparison model using age, level, BB%, K% and current production.
Extended model
Add chase, whiff, their interaction, and impact variables; check whether they improve holdout
performance.
Evaluation
Use season-based train/test separation and report calibration, error and uncertainty rather than only
in-sample fit.
Testable hypothesis
For players with similar age, level and present production, the joint chase/whiff profile may add predictive
information about future offensive outcomes. This is a hypothesis to test, not an established finding from this project.
Limitations
This framework has not been fitted to a labeled historical dataset. It has no validated thresholds, error rates, predictive
accuracy or causal interpretation. It is useful for organizing scouting follow-up questions and outlining a reproducible test.
Reference material
FanGraphs Library: Plate Discipline - metric definitions and interpretation.
Baseball Savant: Swing/Take - pitch-decision context and definitions.
03 / 03